Your problem
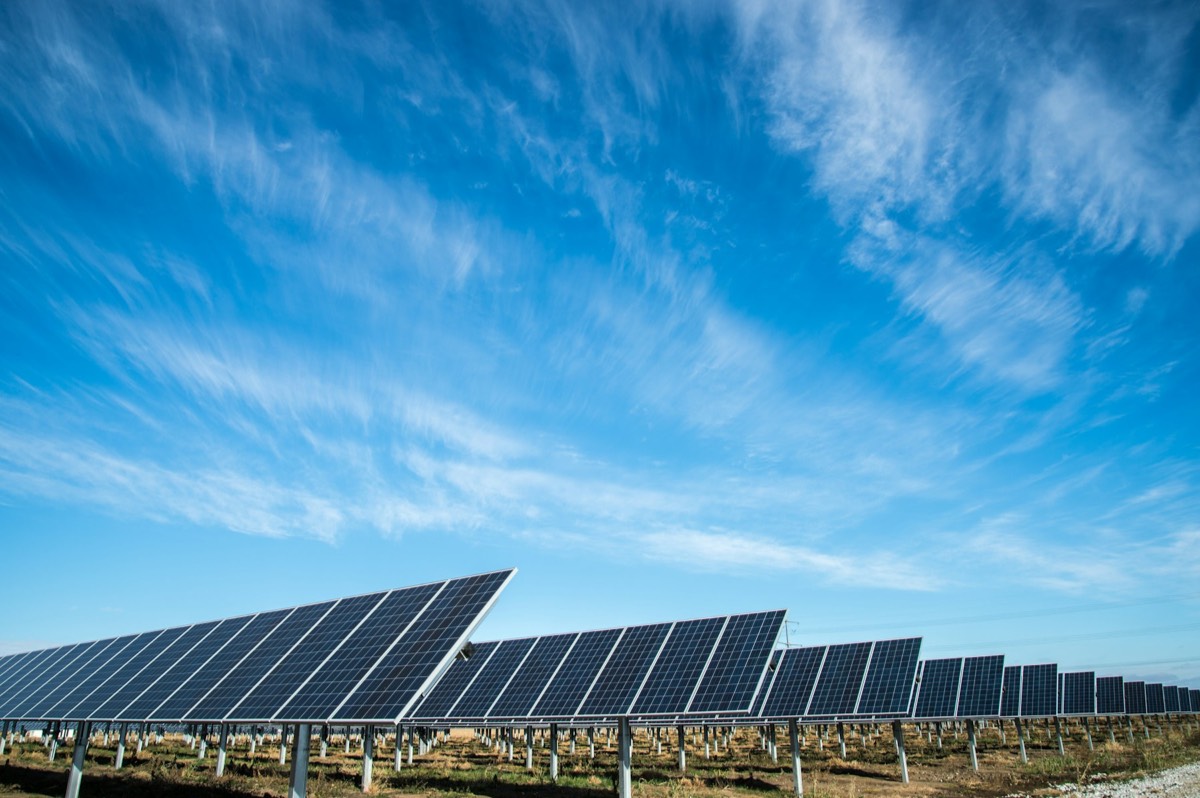
Your solar array is underperforming: and ground-level inspection can't tell you which cells are the problem.
Hot spots, bypass diode failures, soiling, cracked cells, junction-box issues. Each one drags array output down.
Per-module anomaly detection. Findings keyed to inverter/string IDs for direct asset-platform ingest.
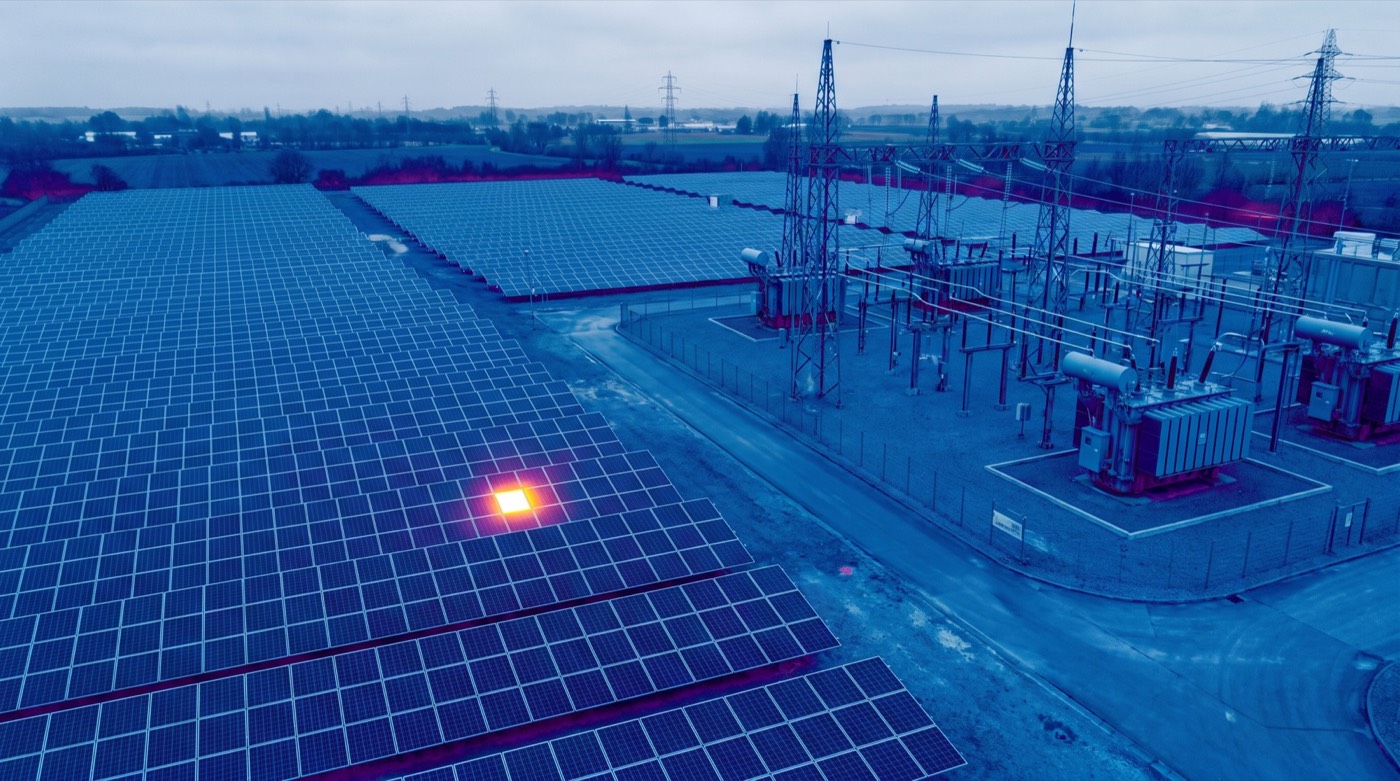
A single flight scans the whole array radiometrically. Each anomaly is detected per-module and keyed to inverter and string IDs — ready to ingest straight into your asset platform.
 Hot modulestring fault
Per-module scanwhole array / flight
Keyed to string IDplatform-ready
Hot modulestring fault
Per-module scanwhole array / flight
Keyed to string IDplatform-ready
Hot spots, bypass diode failures, soiling, cracked cells, junction-box issues. Each one drags array output down.
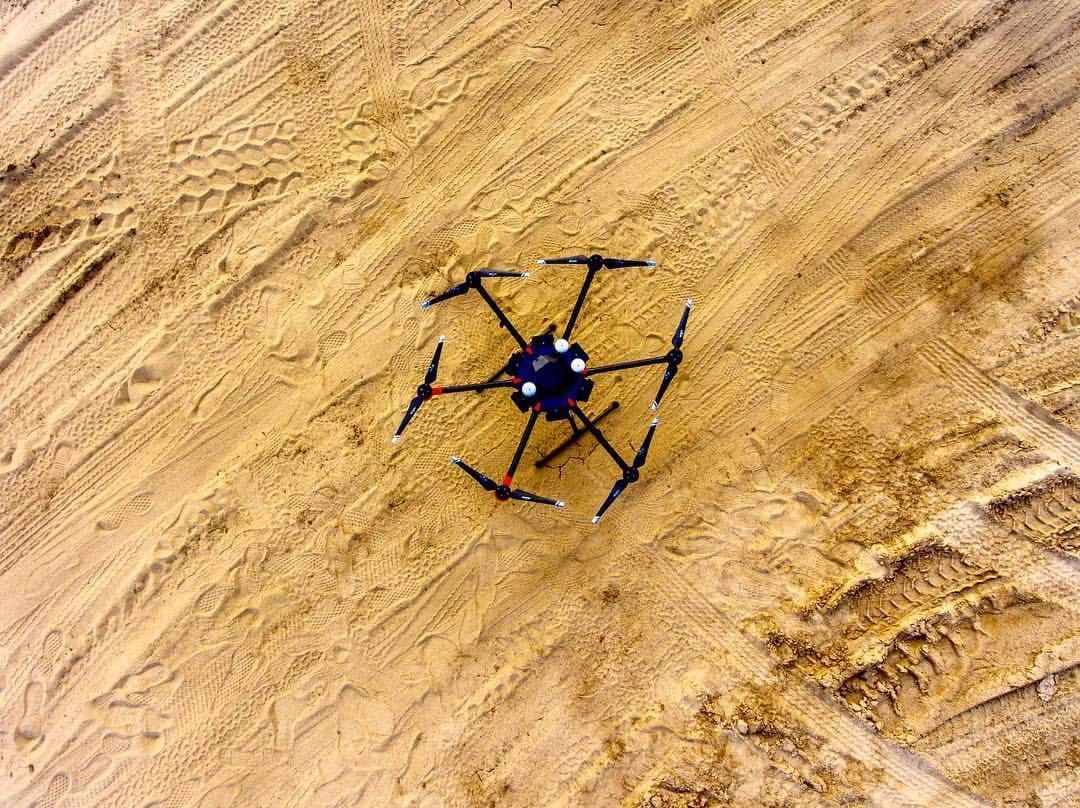
Optimal capture window (high irradiance, clear sky). Sub-degree resolution. Every panel tagged.
False-color thermal imagery. CSV defect list with panel IDs. Recommended repair / replace / clean per module.
One inspection often recovers 1-5% array output. Fast payback on residential, commercial, or utility-scale arrays.
A failing solar module rarely announces itself in the SCADA dashboard. The string still produces power; the array still hits its number; the underperforming panel just sits there, silently dragging yield down. A drone-mounted radiometric thermal camera finds those panels in hours instead of months: flying a planned grid over the array and surfacing every bypass-diode failure, cell crack, soiling pattern, hot junction, and string-level disconnect as a distinct thermal signature.
Thermography only works when there’s enough sun loading the modules. Most O&M contracts cite an irradiance floor at or above 600 W/m²: below that, the temperature contrast between a healthy and a failing module is too low to reliably classify. We measure irradiance on site at the start of the flight, and we don’t fly through cloud-cover windows that drop the reading below threshold. If a weather window closes mid-flight, we stop and re-fly. The deliverable’s value depends on this discipline.
We fly radiometric thermal sensors at 640×512 resolution or higher with a paired visible-light camera for context. Higher sensor resolution pushes the small-defect detection limit further out: useful on utility-scale arrays where a single failing cell is the size of a fingernail at altitude. Reporting is structured to align with the IEC TS 62446-3 guideline that most O&M contracts reference for PV plant thermography: we confirm your contract’s specific version on the kickoff call so the deliverable matches what your asset team expects.
Solar EPCs (commissioning scans pre-acceptance), independent power producers and utility owners (annual yield-protection scans), O&M providers (routine and post-event inspections), and commercial/industrial solar asset owners with rooftop or carport arrays large enough that a manual IV-curve sweep isn’t cost-effective.
Our FAA-certified pilots are ready to deploy. Get your free site assessment today.