Skip to content
SKYFLEX Get a Quote

Forestry & Timber Drone Surveys

Canopy Height Model, per-tree counts, stand-level volumes, post-disturbance damage assessment.

Inside the deliverable

Every stand measured. Not an acre walked.

Aerial capture turns timberland into numbers: canopy height models, per-tree counts, stand-level volumes, and post-disturbance damage assessments.

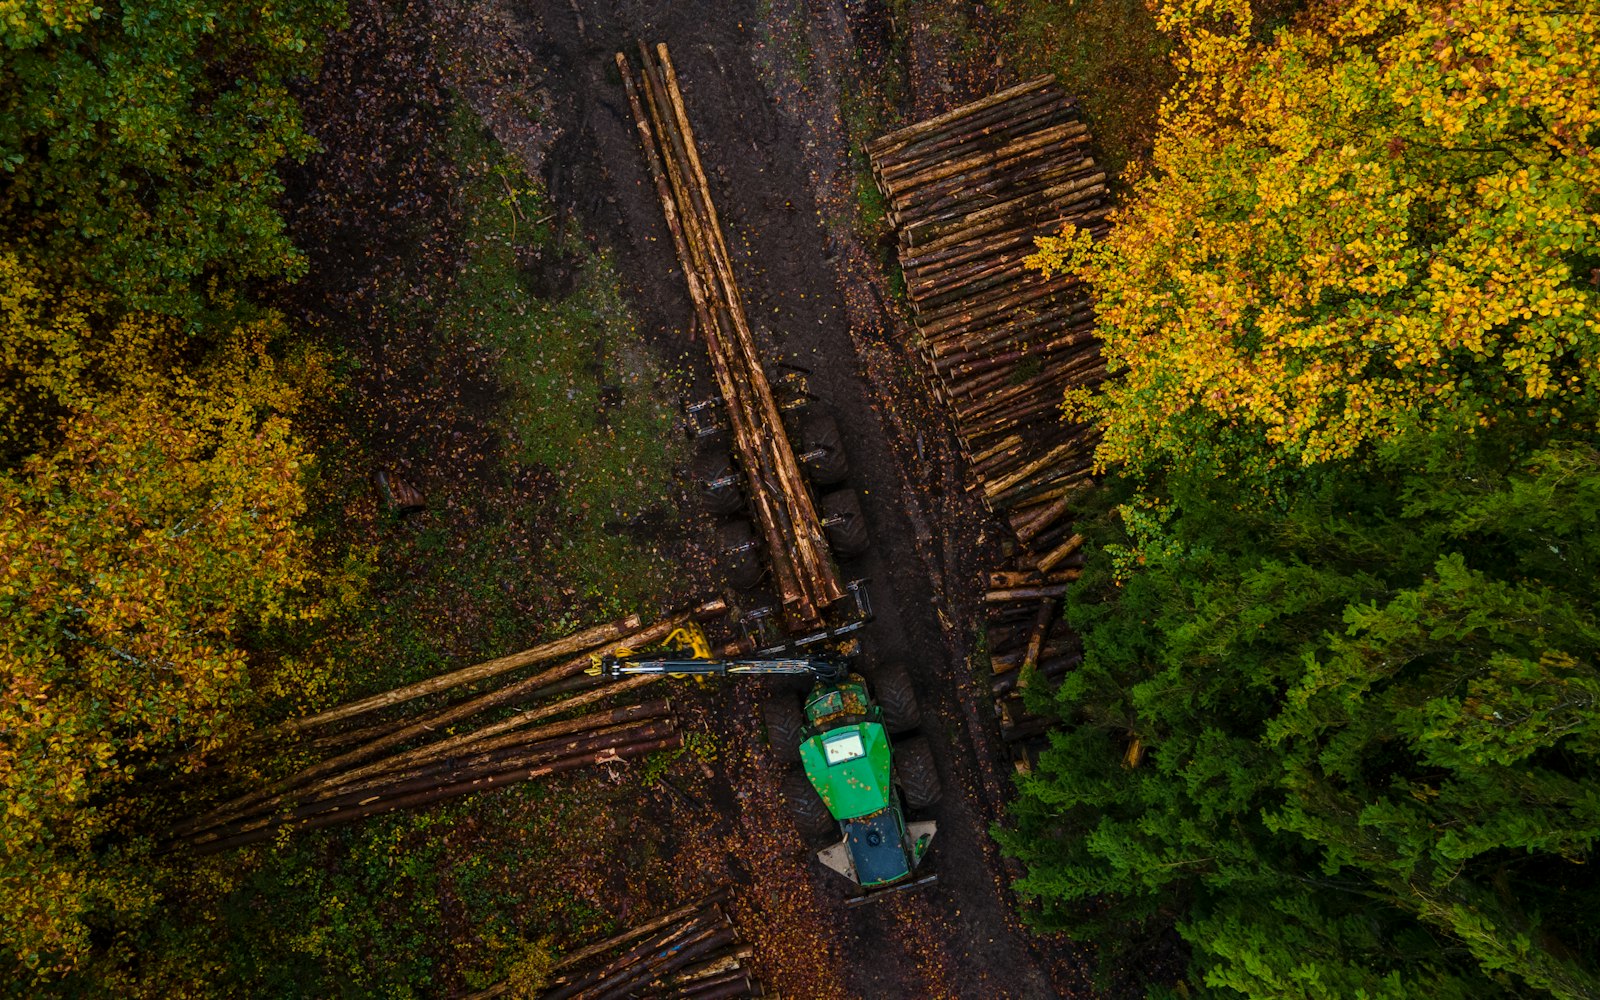
Top-down aerial of an active timber harvest — forwarder, staged log decks, and standing forest Canopy height modelper-tree counts Cut volumes by decklogged from the air Stand boundariesmapped & measured
  • Canopy height modelper-tree counts
  • Cut volumes by decklogged from the air
  • Stand boundariesmapped & measured
How forestry & timber drone surveys help your business

Four steps from your problem to your win.

Your problem

You need to know what's in your timber stand: species, stocking, health, volume: without walking every acre.

Traditional cruise: days of walking, statistical sampling, lots of estimation. Slow and incomplete.
What we capture

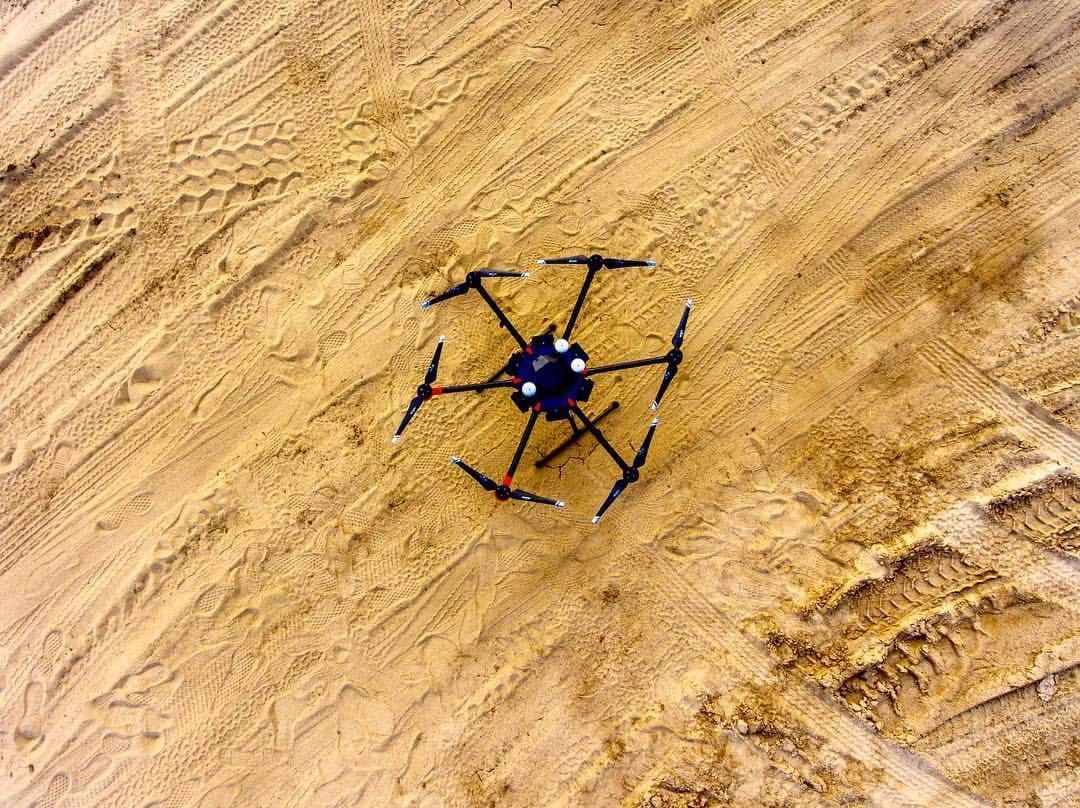
Our drone flies the stand, capturing high-resolution aerial photos + multispectral imagery (NDVI).

Canopy structure. Vegetation health index. Tree-level identification with photogrammetry post-processing.
The deliverable

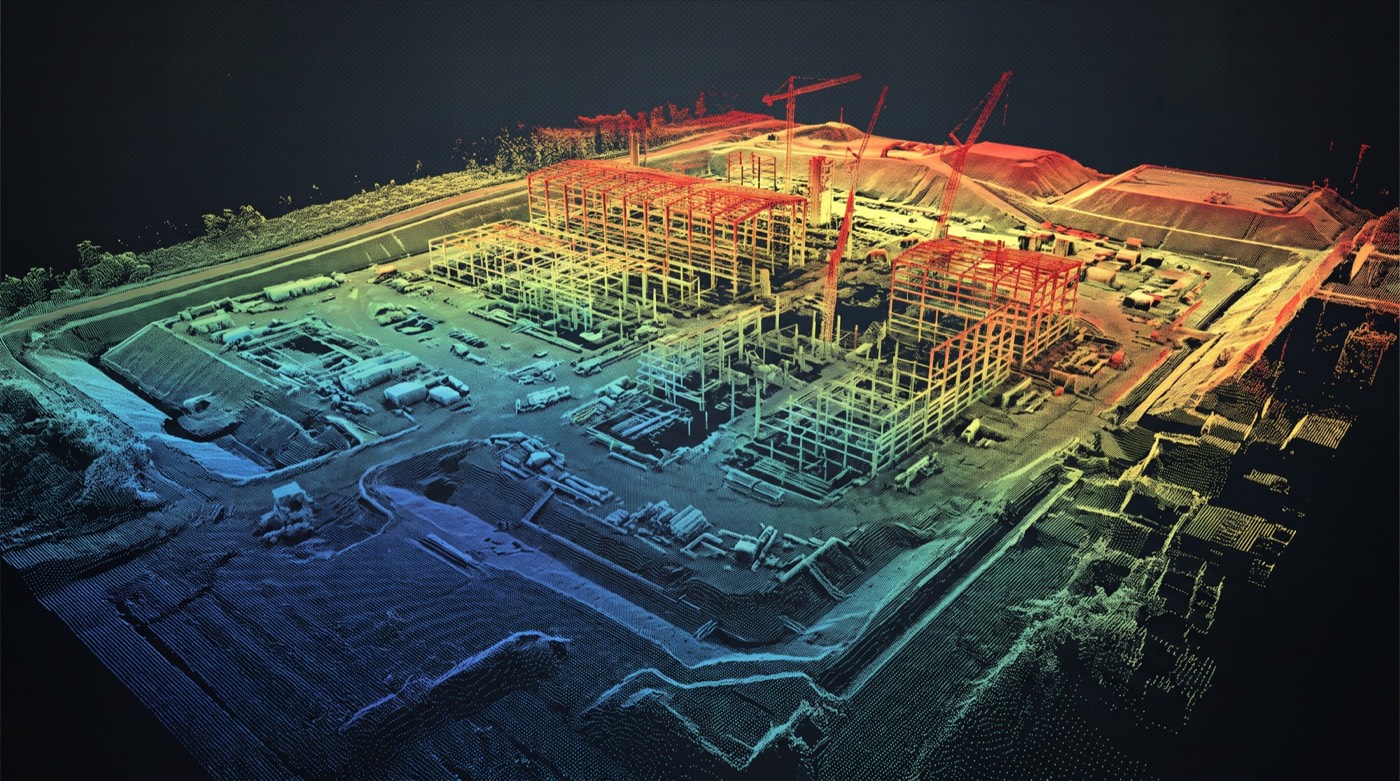
Stand map with stocking density, canopy cover, NDVI health, and tree-level volume estimates.

GeoTIFF, shapefiles, CSV stand summaries. Compatible with timber-management software.
How it pays off

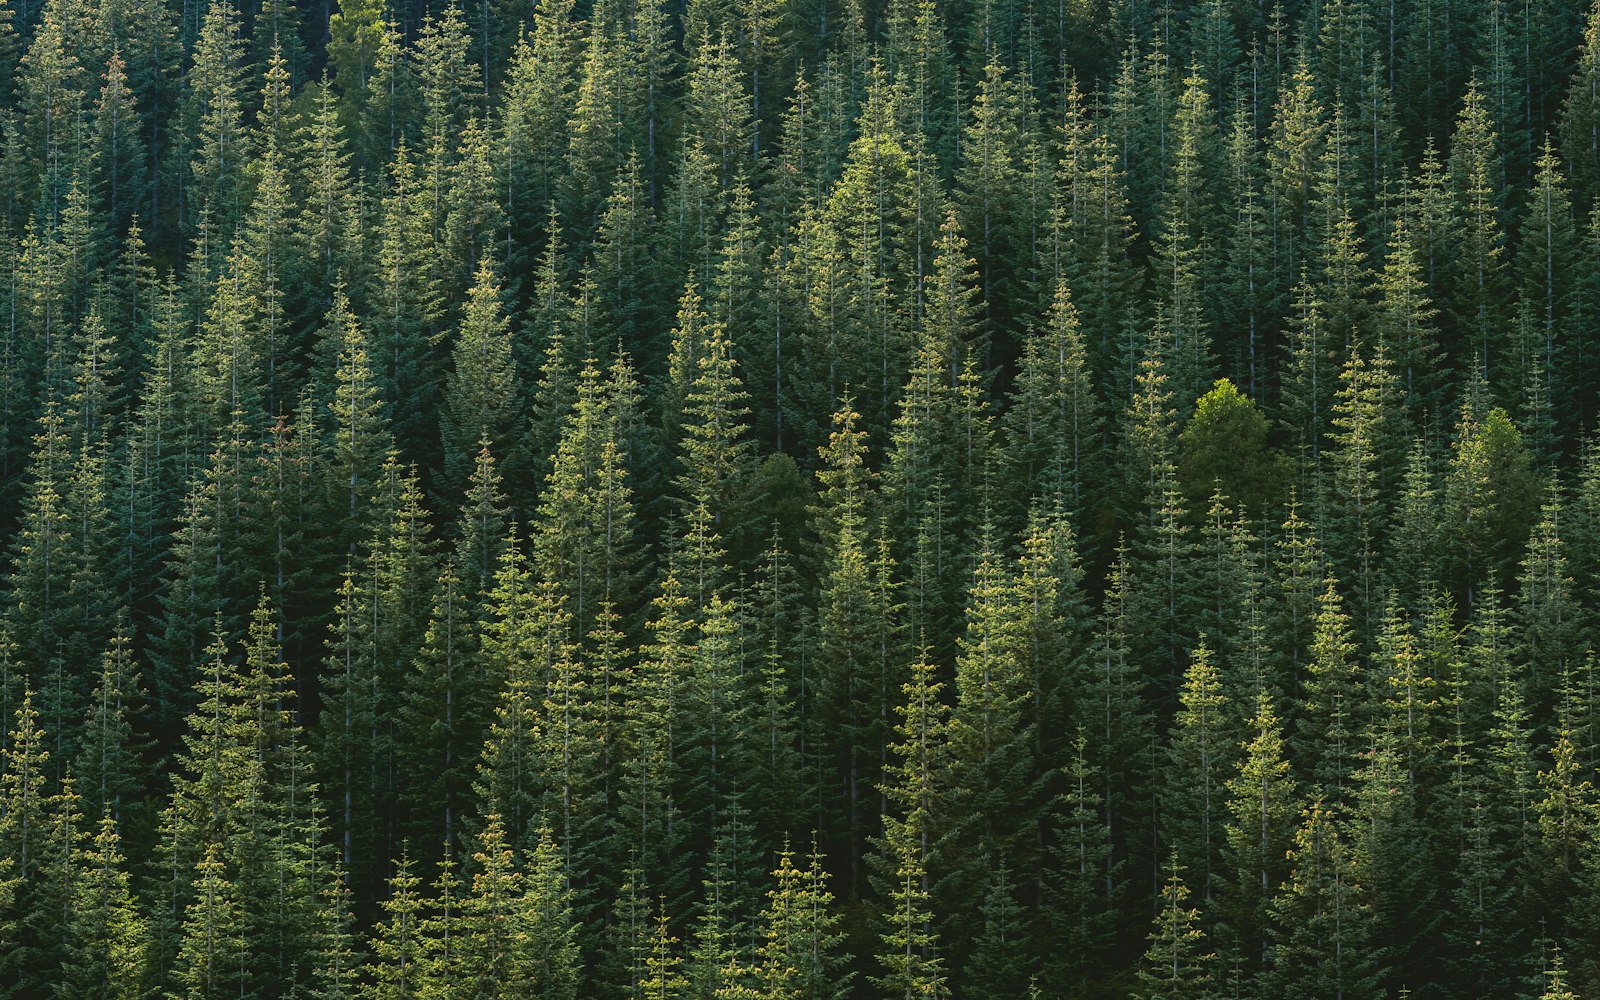
Better harvest decisions. Health monitoring across seasons. Defensible documentation for buyers and lenders.

Especially valuable for managed timber, conservation easements, wildfire risk assessment, post-storm damage.

A drone flight over a working timber stand produces something a clipboard cruise can’t: a canopy height model of the whole tract, every tree counted and crown-delineated, stand-level volume estimates tied to defensible measurements. Foresters use it for inventory updates, harvest planning, regeneration tracking, road and landing layout, and rapid post-disturbance assessment after fire, wind, or pest events.

What we deliver after a stand survey

  • Canopy Height Model (CHM) raster across the entire flight area: the foundational layer for tree counts and stand-level metrics.
  • Digital Terrain Model under canopy when we fly LiDAR: multi-return penetration gives you the bare-earth surface even through closed cover.
  • Classified point cloud in .LAS / .LAZ with ground / low vegetation / mid-canopy / upper-canopy classes separated.
  • Per-tree height and crown polygons: individual-tree inventory output when point density supports it.
  • Stand-level volume estimates aggregated from the per-tree layer.
  • Orthomosaic with stand boundaries overlaid: the visual deliverable for stakeholder review.

LiDAR vs photogrammetry: pick the right tool for the canopy

Closed-canopy stands need LiDAR. Multi-return scanners pulse through gaps in the leaves and record both the top-of-canopy and the ground beneath in the same flight, which is the only reliable way to extract a DTM under thick cover. Open or post-leaf-off stands can be flown with high-resolution mapping cameras at lower cost: the surface is visible and the CHM comes from photogrammetric reconstruction. We pick the sensor based on canopy class and the deliverable you actually need; we don’t push LiDAR on a stand that doesn’t require it.

The questions foresters and managers ask first

  • Will it penetrate dense canopy? LiDAR does. Photogrammetry doesn’t: that’s why the sensor choice matters and why we ask about canopy density before quoting.
  • What ground accuracy can we expect under cover? LiDAR-derived DTMs typically come in tighter than photogrammetric ground in vegetated terrain: we report against ground control on every project so you know what the deliverable can be trusted to measure.
  • Can you give us species-level information? Drone surveys give you structural information (height, crown shape, canopy density) reliably. Species-level identification at scale is a separate workflow that combines drone data with hyperspectral or ground sampling: we’ll scope that as a project addition when it’s part of what you need.
  • How repeatable are these flights across seasons? CHM is reliable year-over-year. We re-fly to the same control network so successive surveys can be differenced for growth, mortality, or harvest documentation.
  • Will the deliverable land in our forest-management software? We confirm the target stack (ArcGIS, FOREST, Trimble, custom GIS) during scoping and deliver in formats that drop straight in.

Post-disturbance assessment: days, not months

After a wildfire, a major wind event, or a pest outbreak, the question is how much of the stand is salvageable and how much is gone. Drones answer that in days. We coordinate airspace with any active wildfire TFRs, fly the affected area, and deliver a stand-level damage map keyed to the same boundaries you used for the pre-event inventory: so the comparison is direct, not interpretive.

Who buys forestry surveys

Timber companies (inventory updates, harvest planning, regeneration tracking), forest-management consultancies (client-portfolio surveys), conservation NGOs (habitat documentation), public land managers (state forestry agencies, federal land owners), and carbon-project developers building or verifying biomass baselines.

How it’s priced

  • Per-acre with a minimum mobilization fee: the dominant model.
  • Rate sensitive to required point density: structural CHM is the lower band, individual-tree inventory at high resolution sits at the upper band.
  • Access logistics drive mobilization: remote stands, gated access, or post-disturbance debris reach all add to the day count.
  • Re-fly programs at annual or post-event cadence are quoted as multi-flight contracts with mobilization amortized across the program.

FAA Part 107 covers the flight; state forestry regulations and landowner permissions are coordinated as part of the engagement.

Ready to start your mission?

Our FAA-certified pilots are ready to deploy. Get your free site assessment today.